Business Intelligence(BI) and Business Analytics(BA)
Every day, the company generates an enormous volume and diversity of data. You need ways and tools to transform your data into actionable insights in order to make better decisions, discover problems, and be profitable. All data management systems, including business intelligence (BI) and its subsets, business analytics and data analytics, are used to interpret historical and current data and provide insights. Let's start with how analytics and business Intelligence helps in business.
Features Of Business Intelligence and Analytics Tools
Connectors
- Data Connectors
- Flexible Data Integration
- Join Data Sources
Analysis
- Drag & Drop
- Custom Fields & Expressions
- Cross Queries
- Trends Analysis
- AI Alerts
- Predictive Analytics
Dashboards
- Templates
- Cross-device Accessibility
- Interactive Features
- Custom Design
Reporting
- Sharing Options
- Embedding
- Client Reporting
- Viewing Rights
Connectors
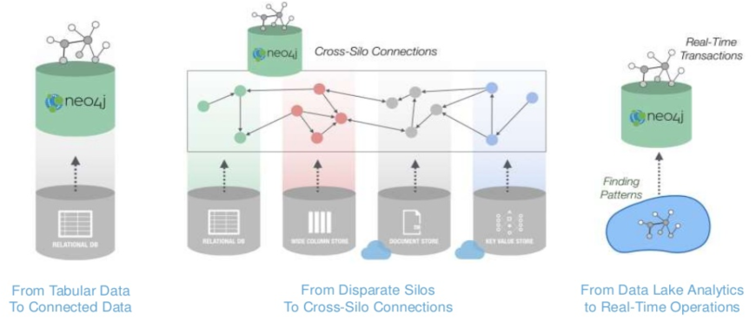
Companies acquire data from a variety of sources, regardless of their size. This information is typically maintained in a variety of databases, external programmes, or an infinite number of Excel sheets, making it nearly hard to merge diverse data sets and keep all sources up to date.

Analytics
It's time to start making sense of your data after you've gathered it all in one place. This is when the process's analytical phase begins. You no longer need to be a data scientist to comprehend your company data, thanks to the development of current self-service BI tools. While executing complex analyses to take your data to the next level, this set of BI capabilities strives to make the analytical process user-friendly, time-efficient, and accessible.
Dashboards
Project manager can view workload on team members and accordingly assign them to various tasks. Project manager can also see holiday, shift duty roster and planned leaves of team members to manage task allocation.
Team members can book time spent against each task in the system allowing them to submit time sheets to the project managers for approval.


Reporting
The reporting part of the data analysis process is the focus of the following section of our list of BI software capabilities. Efficient reporting aims to make the lives of businesses simpler by providing cost-effective options for creating interactive reports. Traditional reporting methods are time-consuming since they need a lot of human labour. As a result, when purchasing BI software for your business, ensure that the tool you select allows you to leave the headaches of manual reporting behind, giving you more time to study and extract actionable insights to enhance your company's performance.
How BI and Analytics helps Businesses
Analytics and visualization solutions provide better insight and present the information in a more intuitive format, making it easier to evaluate.
Data Integration from multiple data sources.
Historical data (events) analysis to forecast/observe seasonal patterns.
Data Integration from multiple data sources.
Benefits of BI and Analytics Tools
Fast and accurate reporting
Valuable business insights
Competitive analysis
Better data quality
Increased customer satisfaction
Identifying market trends
Increased operational efficiency
Improved, accurate decisions
Increased revenue
Lower margins